Navigation
Navigation bar
The HIV Mutation Browser is divide into two sections. The first section contains information about the resource, including the layout of information and the source of the mutation information. This information is available in the Home, Help and About pages. The second section contains the curated HIV mutagenesis and mutation data. This mutagenesis and mutation data is navigable through 3 different views: the Sequence, Feature and Table (described below) views each of which groups mutational data on the gene level. All views are accessed by clicking on the relevant button in the navigation bar (see Figure 1).

Figure 1:Navigation bar
-
-
Home
Landing page for the HIV Mutation Browser resource. - Help
Contains a description of the website layout and information about how to navigate the mutagenesis and mutation data in the resource. - About
Page describing the source of the data in the database and various statistics for the database. - View tag
Allows users to chose the navigation type used to explore the resource. Three view types are available: Sequence, Feature and Table (described below). - Gene tag
Allows users to chose their gene of interest. - Search
Allows the user to carry out text searches of the database content.
-
Home
Mutational data access overview
The mutational data can be accessed through 3 separate entry pages. These views can be accessed by clicking on the buttons adjacent to the "view" tag (Sequence, Feature or Table). The mutagenesis data is grouped and navigated by protein. By default the Gag protein is displayed,the buttons adjacent to the "gene" tag on the navigation bar allows the user to select their protein of interest.
-
Sequence
View of the raw sequence of the protein. - Feature
Visualisation of the biological features of the protein. - Table
Table of the residues annotated with conservation and structural attributes.
View Types
Sequence view
The sequence view displays the amino acid sequence of the selected protein. Residues with mutagenesis data are displayed in blue boxes and detailed mutagenesis data for a residue can be accessed by clicking on a residue. Hovering over a residue with mutagenesis information will display the residue position and the number of mutations annotated for that residue. Selected residues are underlined and previously visited residues are displayed in a black box. The sequences are divided into sections of 80 amino acids, numbering to the sides of the sequences are the position of the first (left) and last (right) residue in that line.

Figure 2: The sequence view of a HIV protein
Feature view
The feature view displays the selected protein and annotates it with known features. Detailed mutagenesis data for a residue can be accessed by clicking on the residue in the sequence of the selected protein ("HV1H2 sequence" row) or by clicking on the bar plot depicting the number of mutagenesis experiments for a residue ("Number of mutations for residue" row). The offset row displays the position of the residues in the protein and hovering over the a residue in the sequence displays the position of that residue in the protein.
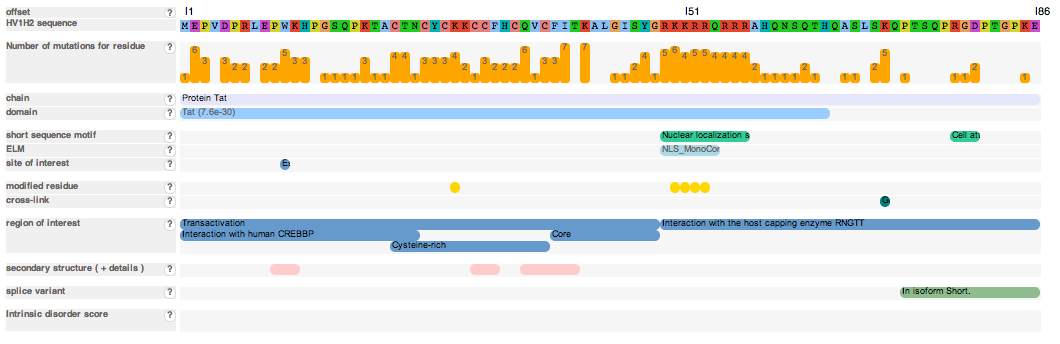
Figure 3: The feature view of a HIV protein
A full list of the displayed feature and their descriptions are displayed below. Note that not all features are present in every protein. Hover over the question mark (to the right of the row name) to display a description of the content of the feature row. Hover over a feature to display additional information about the feature. Domain, ELM and PDB (click "+details" on the secondary structure feature) features also link to external database describing the features in more detail.
- offset
Residue number in the protein - HV1H2 sequence
Sequence of the selected protein in the HV1H2 HIV subtype coloured by ClustalX colouring - Number of mutations for residue
Barplot of the number of mutations annotated for each residue. Click on a bar for more details - active site
Active site for enzymatic domain - chain
Chain data for the protein - coiled-coil region
Regions predicted to form coiled-coils - compositionally biased region
Compositionally biased regions of the protein - cross-link
Residues that have cross-linked modifications such as sumoylation - disulfide bond
Residues that form a di-sulfide bond - disorder
IUPred intrinsic disorder score. Score ranges between 0 and 1, scores closer to 1 are more likely to be intrinsically disordered. Scores close to 0 are predicted to be globular. Red line under the plot marks residues that have an IUPred score > 0.4 and are predicted to be intrinsically disordered - DNA-binding region
DNA binding region - domain
Globular/family domain annotated by Uniprot or Pfam - ELM
Short linear motifs as annotated by ELM - glycosylation site
Residues that have been modified by the addition of a sugar moiety - initiator methionine
Cleaved N-terminal methionine - lipid moiety-binding region
Residues that have been modified by the addition of a lipid moiety - metal ion-binding site
Metal contacting residues - modified residue
Residues that have been post-translationally modified (information from UniProt) - PDB
Regions that have been structurally solved by NMR or X-ray crystallography - peptide
Peptide products of cleavage - pfam
Regions defined by Pfam as a domain or family descriptor - phospho ELM
Post-translationally modified residues annotated by the phospho.ELM resource - region of interest
Regions with experimental evidence for function - secondary structure
Regions that have been shown to form secondary structure by NMR or X-ray crystallography - sequence conflict
Residues that have possible misannotation in the reference subtype - sequence variant
Single nuceotide polymorphism - short sequence motif
Short linear motifs as annotated by UniProt - signal peptide
Signal peptide - site
Sites with experimental evidence for function - splice variant
Regions in non-constitutive exons - topological domain
Regions with annotated position relative to a transmembrane region. Specifies sub-cellular compartment of region - transmembrane region
Regions predicted/shown to be embedded in a membrane - zinc finger region
Zinc binding domains
Sequence annotation
Features
Table view
A tabulated view of the basic attributes of the protein and the number of mutagenesis and mutation experiments available for each position in the protein. The table displays information about the conservation, structure and chain. Detailed information for a residue of interest can be accessed by clicking on a row in the table. Only residues with mutagenesis and mutation information is displayed in the table. The selected row is underlined and boxed. The text in visited rows are displayed in bold.
-
Position
Position of the residue in the selected protein. - Amino acid
Residue at that position. - Site conservation
A breakdown of the proportion of each residue in that position calculated using the Subtype Reference Alignments sequences available at the Los Alamos National Laboratory realigned using the MAAFT tool. Residues that are present in less than 20% of the sequences are grouped and named "other". - Chain
The chain of the selected protein that contains the residue. - Secondary Structure
Information about whether the position has be shown to adopt a secondary structure in a solved structure of the region. - Number of mutations
The number of mutations annotated at that position.
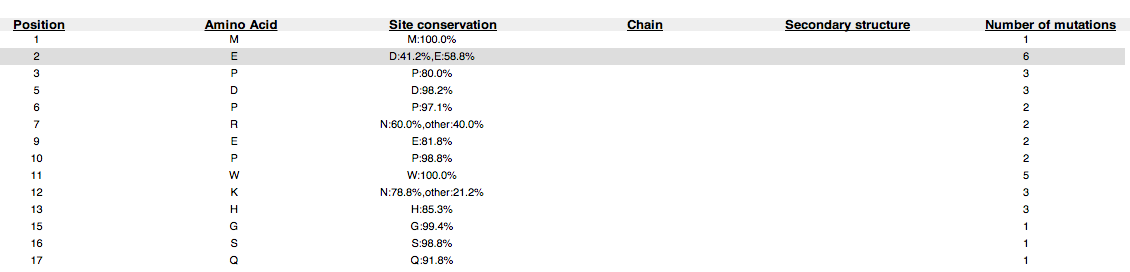
Figure 4: The table view of a HIV protein
Residue view
Overview
The Residue view is split into 2 sections. On the left side, the article data is displayed, this section contains a list of references that describe mutagenesis experiments for the selected residue. On the right side, residue information is displayed, showing, when available, the position of the residue in a solved structure of the containing region and an alignment of the region in multiple HIV subtypes centred around the residue.
Residue panel navigation bar
The residue panel navigation bar allows the user to change and filter the information in the residue panel. As with the information in the residue panel, the residue panel navigation bar is also split into two sections. The left side contains buttons that control the literature information and the right side controls the residue information.

Figure 5: Residue panel navigation bar
- Restrict by mutation
Allows the user to filter the annotated literature by the type of mutation described in the article. Clicking on the button will expand a list of mutations (Click the button again to hide the options). Selecting a mutation will filter the literature list to display only the chosen mutation. The reset button will reset the choice. - Show all sentences
Allows the user to expand the sentences describing the annotated mutagenesis mutations for each article. Reset will hide all the sentence. - Structure
View the position of the residue in a structural context (If a structure of the region is available) - Conservation
View an alignment of the region surrounding the residue of interest across a selection of HIV subtypes - Protein info.
View annotated information about the protein of interest
Literature annotation buttons
Residue information buttons
Residue panel
The literature sub-panel takes up the left hand side of the residue view and contains information about the mutagenesis and mutation information for the residue of interest. The residue information panel takes up the right hand side of the residue view containing structural and conservation information about the residue of interest.
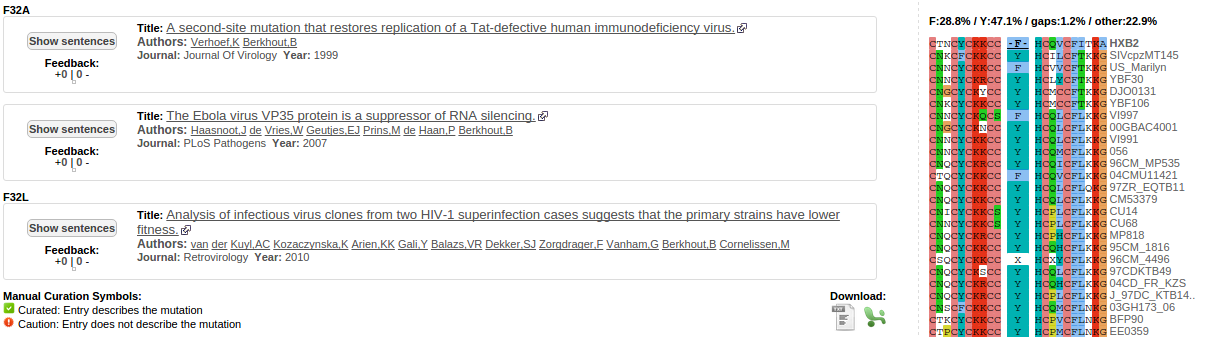
Figure 6: The residue view information panel split between the literature panel (left) and the residue panel (right)
Literature sub-panel
The Literature sub-panel displays the literature containing mutagenesis and mutation information for the residue of interest. The mutational data is grouped by mutation type describing the mutation that has been made or that has occurred (e.g. Alanine to Glycine). This information is displayed on the left hand side of page above the each group of reference. Each article may appear several times, one entry for each mutation type. For each entry the title, complete author list, journal and year are displayed. Clicking on the title will link directly to the article at the publishers website. Clicking on an author will navigate to the entry for that author on the Pubmed website.
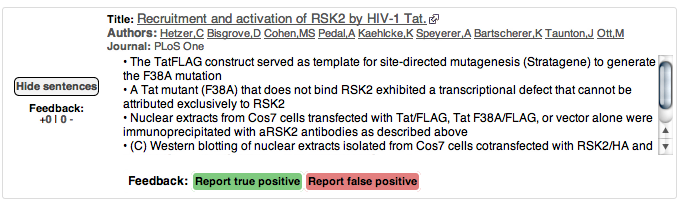
Figure 7:Literature sub-panel
To the left of the citation is a button with the text "show sentences", clicking on this button will display the sentences in the article describing the selected mutation (Clicking it again will hide the sentences). Below the sentences are two buttons allowing the user to flag the quality of the entry either positively or negatively to provide feedback to improve the quality of entries in the database. This feedback is displayed below the "show sentences" button, a feedback score is only given for entries that have not been manually curated by the HIV Mutation Browser team. Manually curated entries are given a green tick (good entry) or a red cross (a bad entry, either annotated in the incorrect protein, incorrect position or incorrectly as a mutation ). The bottom right hand corner of the panel contains links to download the mutagenesis information for the residue in txt and excel formats.
Residue information sub-panel
Structure panel
Displays the position of the residue in a structural context if a structure is available. The residue of interest is coloured red in the structure. JSMol is used to provide a graphical interface to explore the structure.
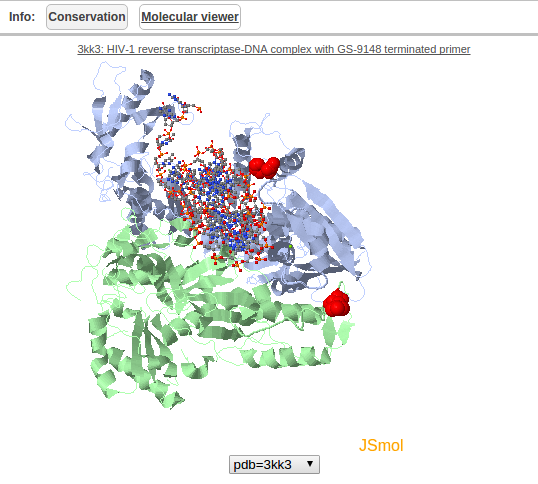
Figure 8: Structural information panel
Conservation
Displays an alignment of the Subtype Reference Protein sequences from the Los Alamos National Laboratory aligned using the MAAFT algorithm. The alignment displays 10 flanking residues either side of the residue of interest across these subtypes. The alignment is coloured by the ClustalW colouring scheme. Subtype names are displayed to the right of the sequence. A breakdown of the proportion of each amino acid at the residue of interest across all subtypes in the alignment is given above the alignment (Residues that are present in less than 20% of the sequences are grouped and named "other").
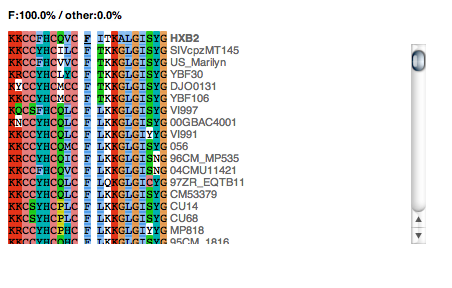
Figure 9: Residue conservation panel
Feedback
If you come across any bugs or have any suggestions please contact us at feedback@hivmut.org